Race & The City
What is the carbon footprint in your neighborhood?
Over the past decade, as Americans have become more concerned about climate change, there has been a push to understand not only our carbon footprints, but also how and why we consume so much.
Research by a number of scholars has shown that all American households are not created equally. The higher you move up the income scale, the more you contribute to global warming. In fact, the wealthiest Americans are some of the most significant emitters in the world, dumping more than twice as much carbon into the atmosphere as their peers in France or Germany. This research is extraordinarily useful, but we need to know more. Does carbon consumption look different based on not only your socioeconomic class, but also because of race? Does it look different based on where you live? And how has that changed over time?
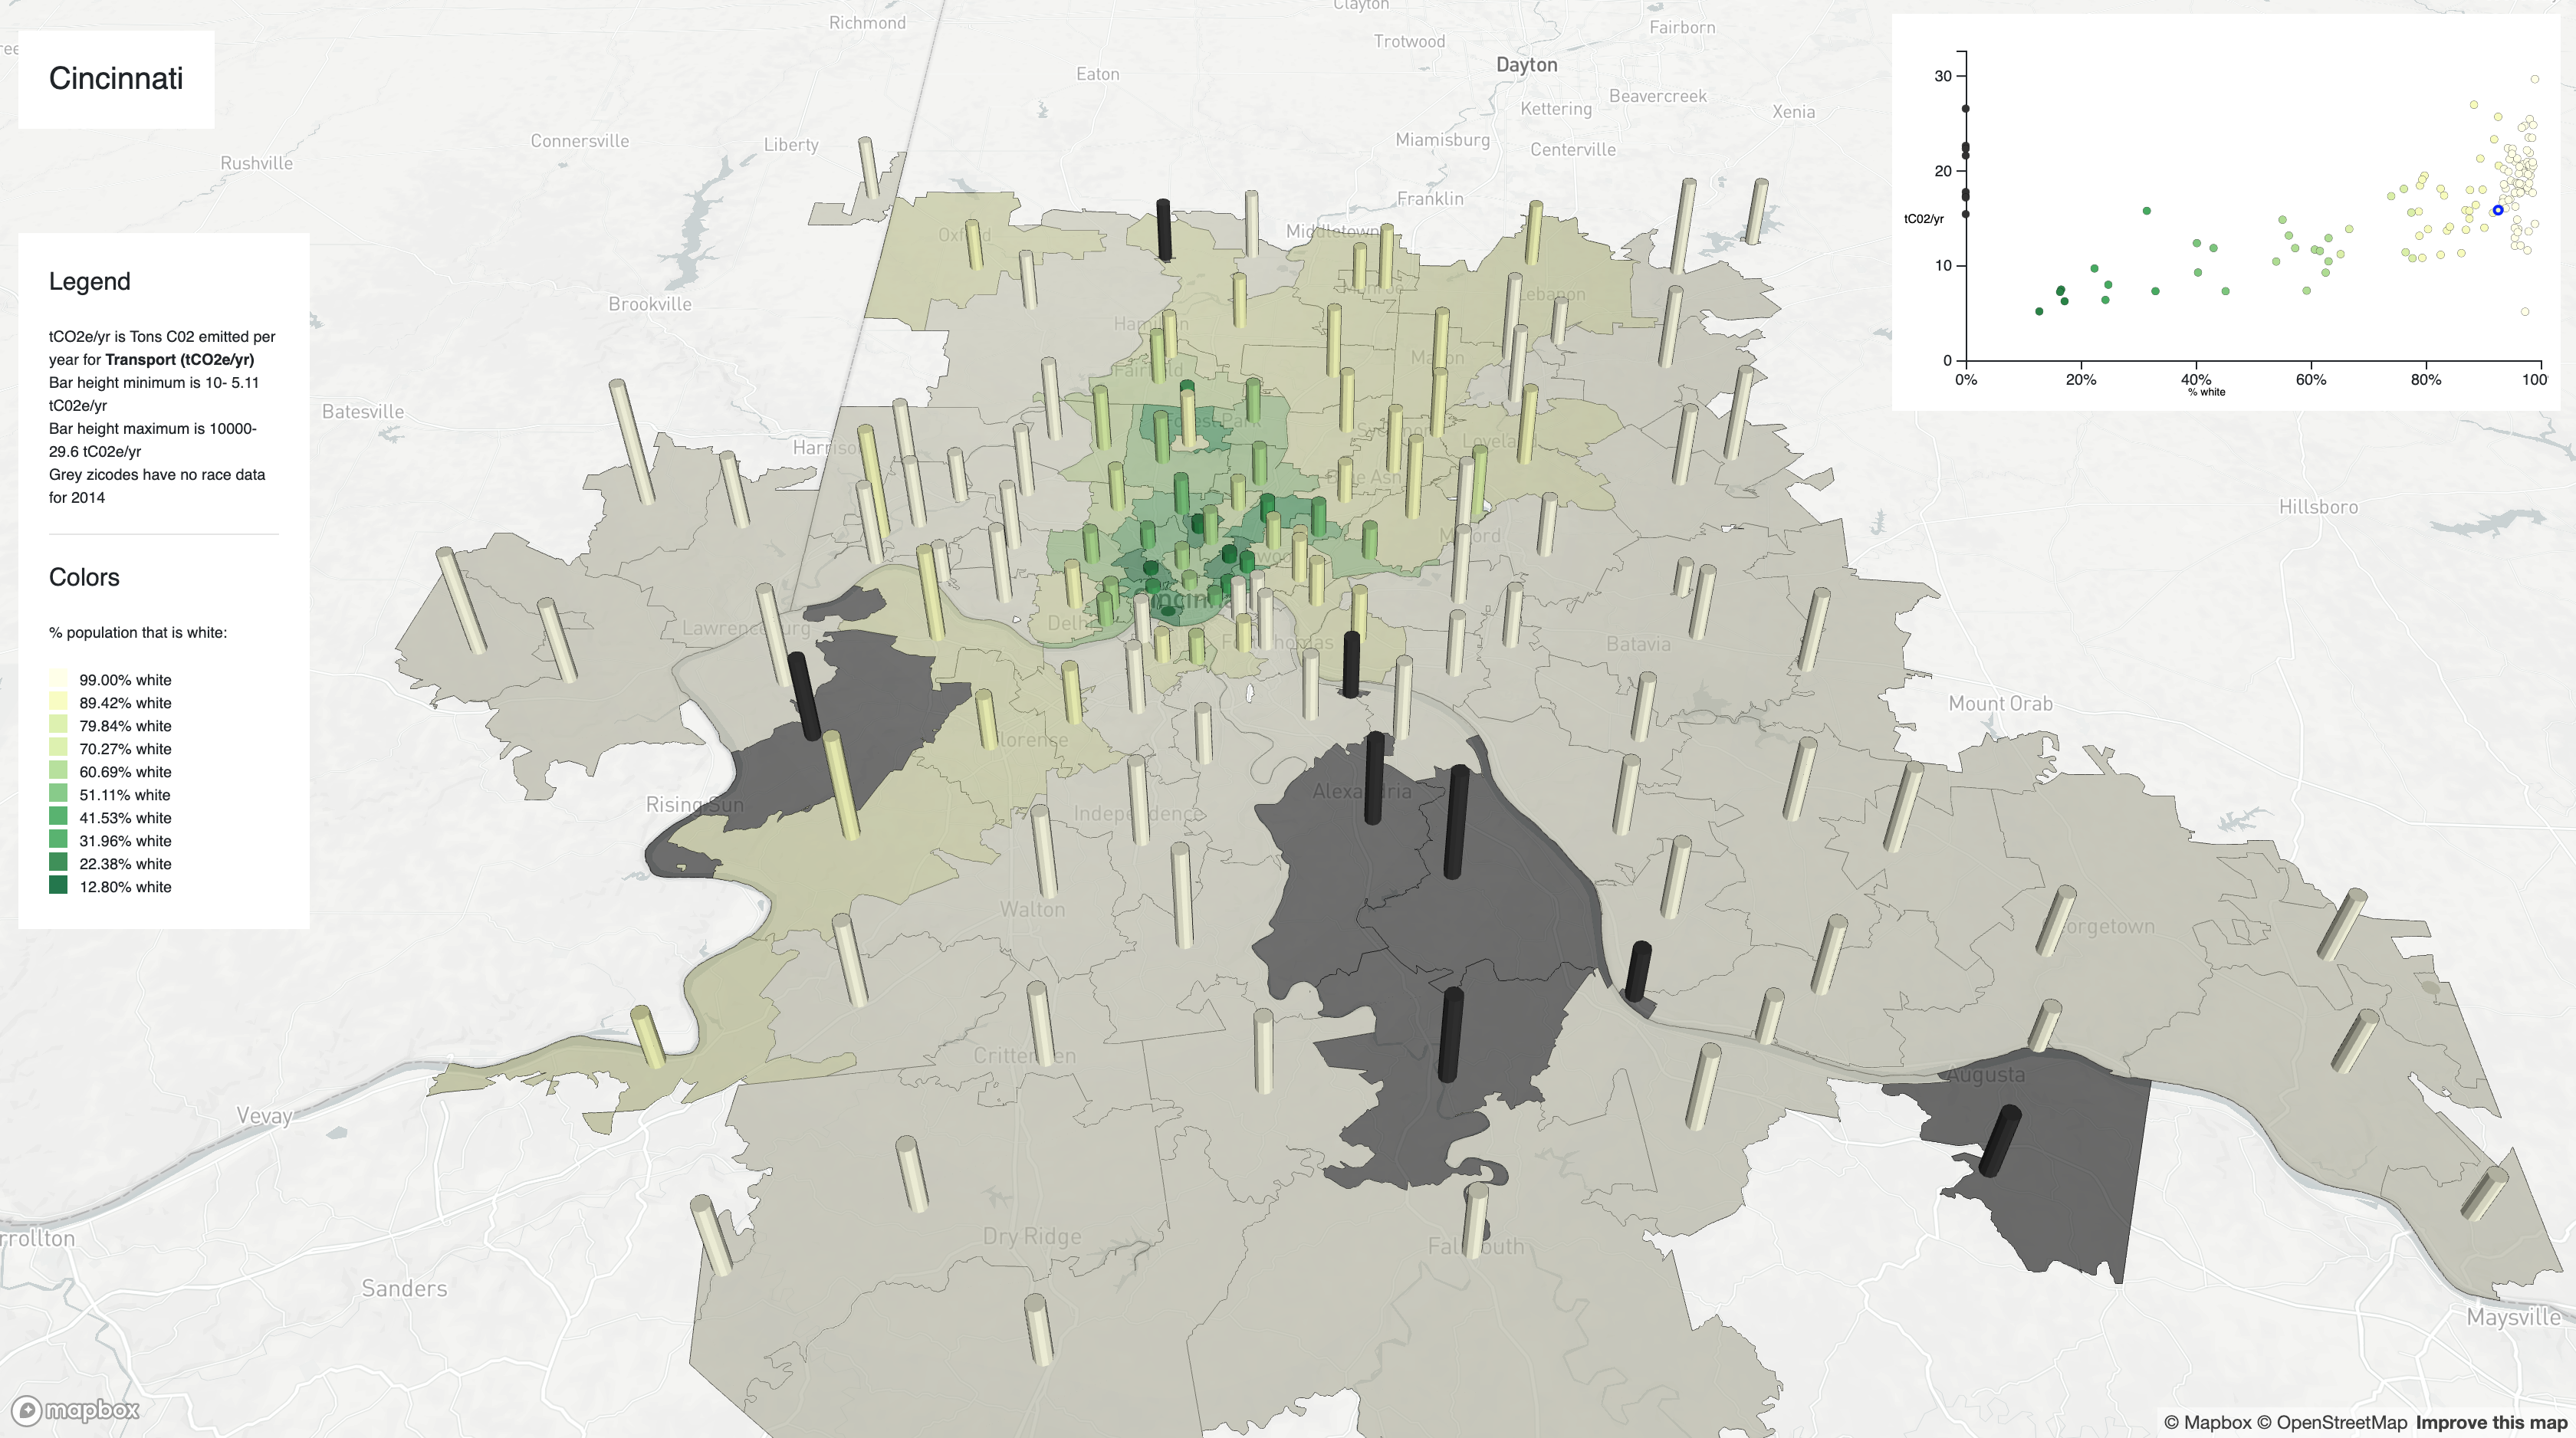
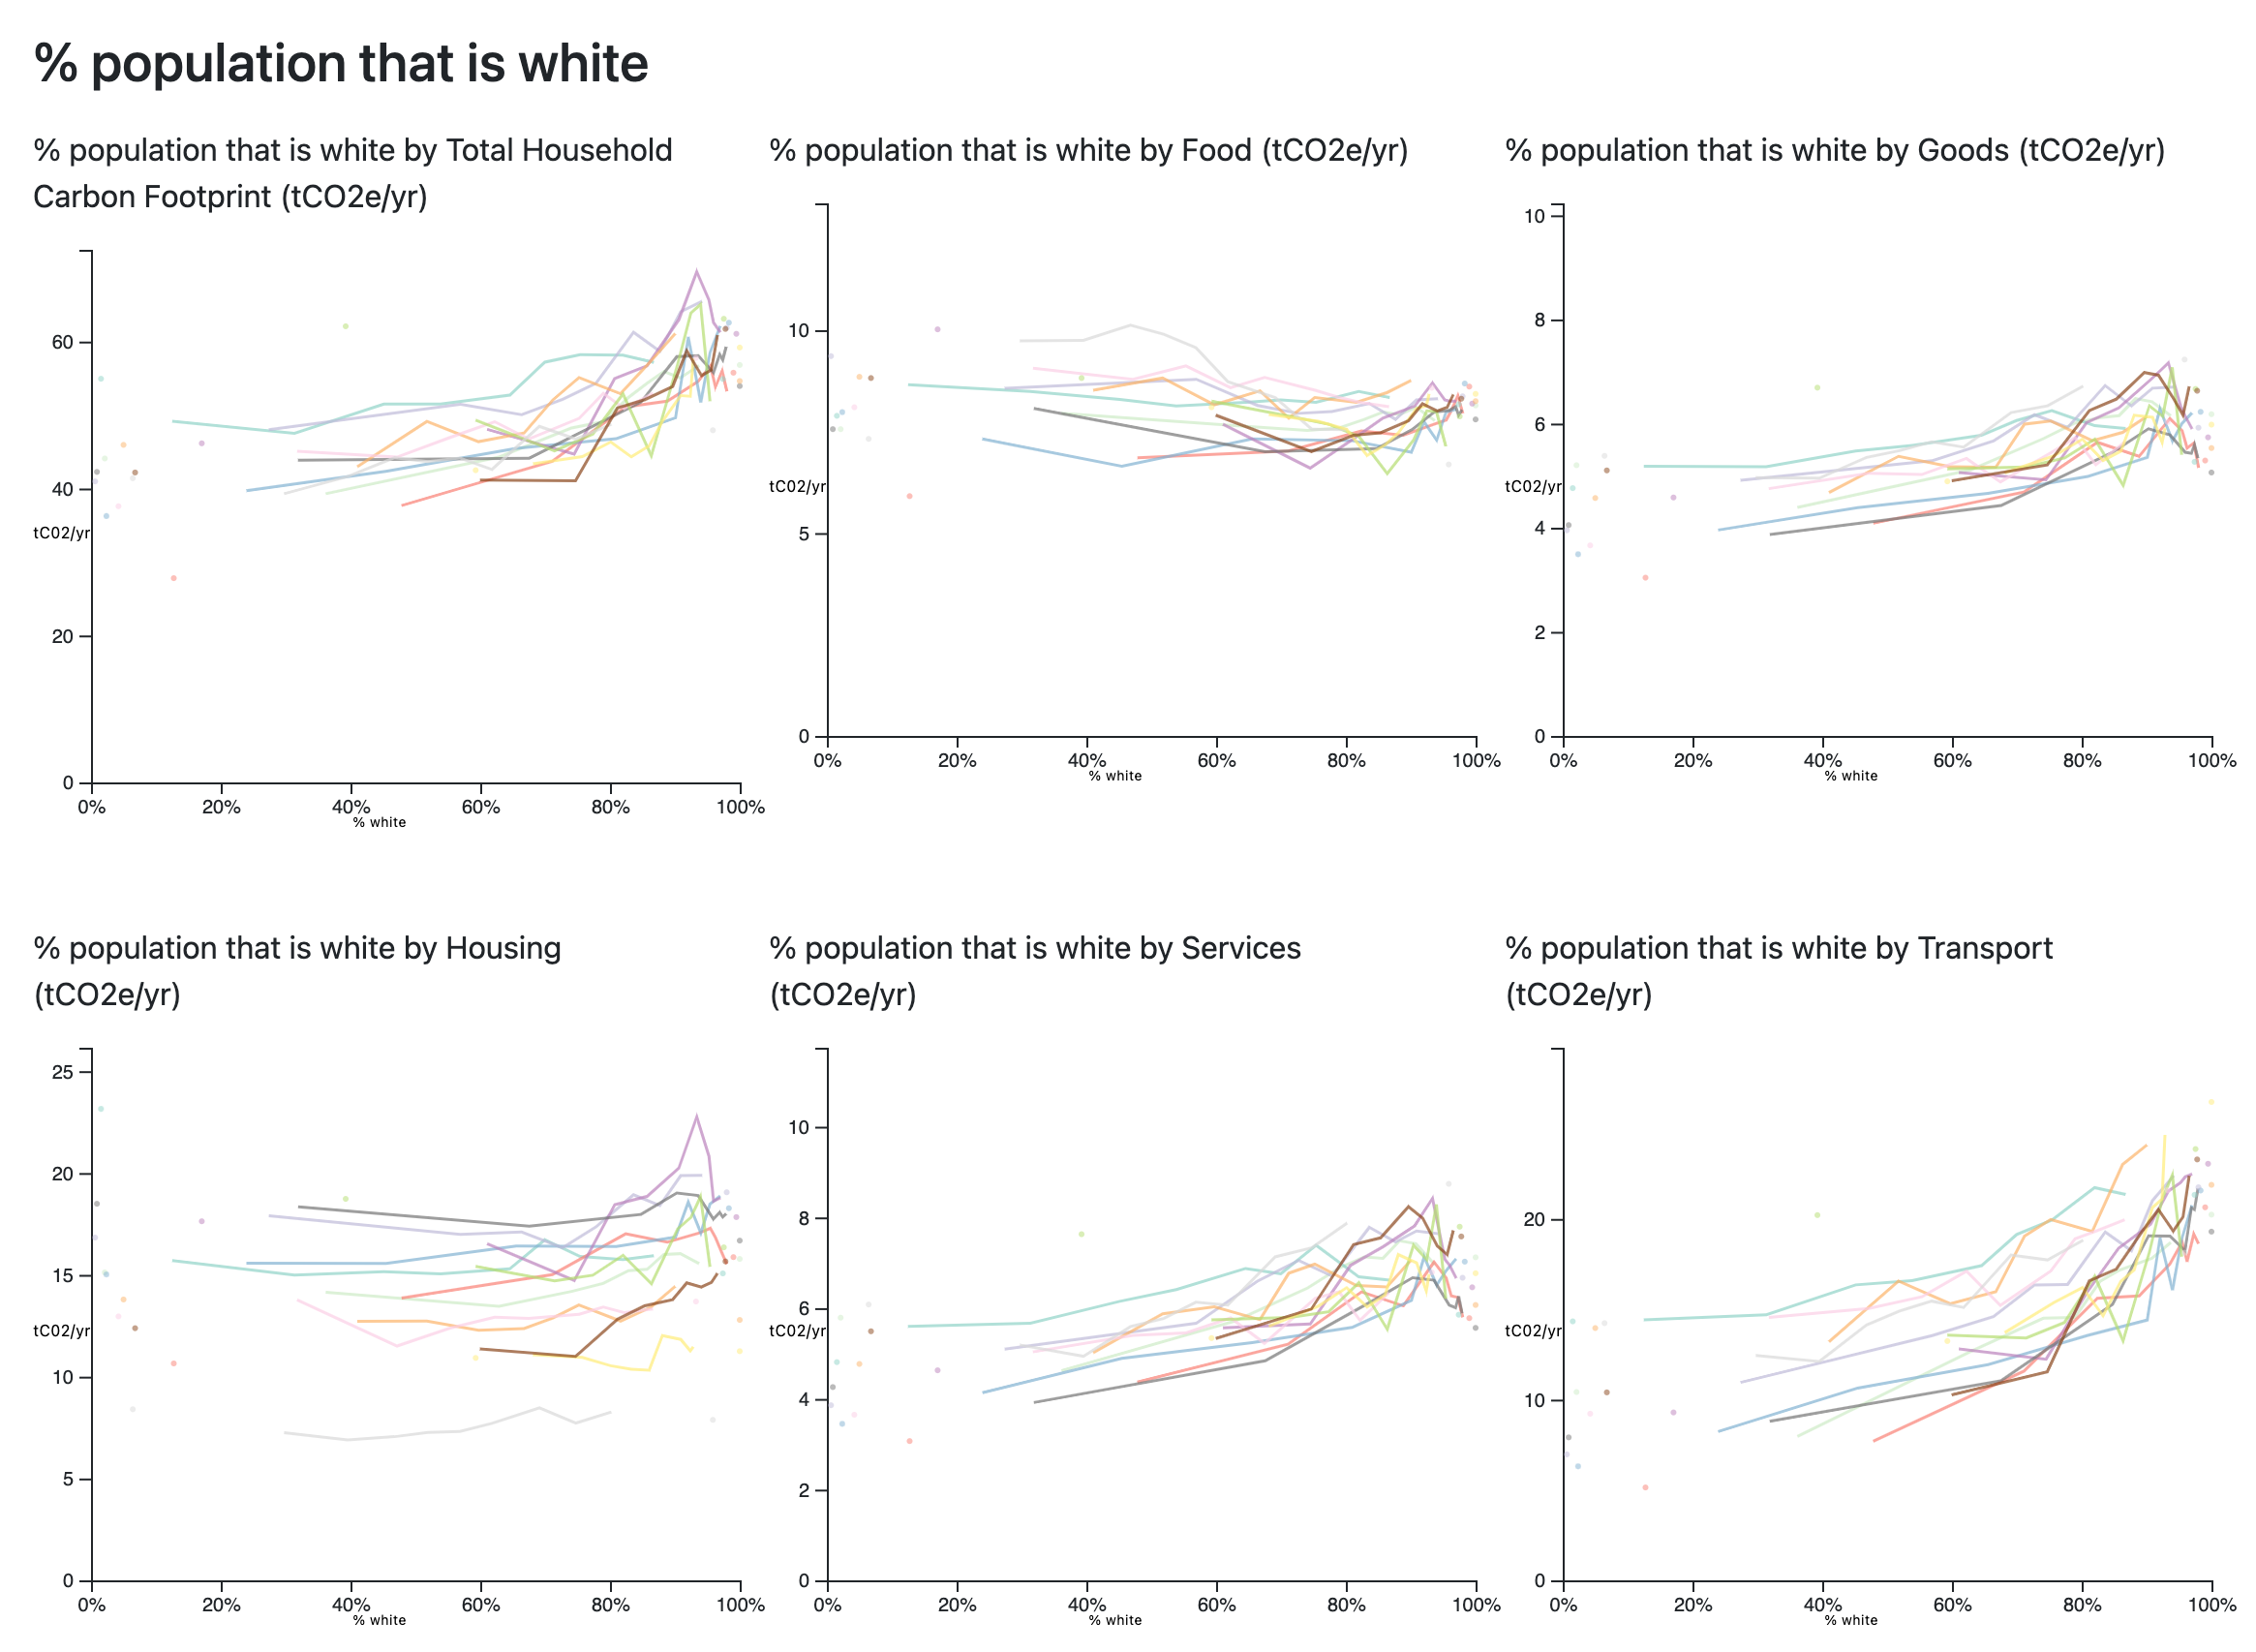
This project looks to explore some of those questions by using data that maps household consumption at the community and neighborhood level in American cities. Our initial project, completed in 2020, showed the correlation between race, income level and carbon consumption in about a dozen American cities.
Based on this research, we are now looking backward, to see if we can map metropolitan carbon consumption historically, over the past fifty years.
If you have questions about this project, or are interested in contributions or collaborations, please contact Rob Gioielli or Amy Koshoffer.
Project Partners
University of Cincinnati Digital Scholarship Center
In collaboration with the Cool Climate Network and the Renewable and Appropriate Energy Laboratory, University of California, Berkeley
Team Members
Rob Gioielli, Associate Professor of History
University of Cincinnati Blue Ash College
Project Director
Amy Koshoffer, Woolack Kim, Ezra Edgerton, Jennifer Latessa